Business Data Analysis - Dashboards & Reports For SMEs
Transform your business data into clear and useful information for better business decisions and a competitive edge.

In today's business world, companies collect large amounts of data every day. However, many businesses struggle to turn this data into useful information that supports decision-making. In an ever-changing market, quick access to reliable data can make all the difference.
The data of a business can come from various sources, such as sales systems, accounting software, customer relationship management (CRM) systems, e-commerce platforms, marketing activities, or even from external market sources. However, in many cases, this data remains scattered across different systems or files and is not fully utilized..
Often, businesses do not have an immediate view of key indicators, such as actual sales performance, profitability by product, or customer behavior. Additionally, there may be significant data that could be collected from available market systems and tools, but have not yet been integrated into the decision-making process.
The utilization of appropriate data analysis tools and dashboards can help the business consolidate its data into a unified environment and enjoy the following strategically important benefits.
Immediate picture of the company's performance
You monitor key indicators in real time such as sales, profitability, and productivity.
Making better decisions
The management can rely on real data and not just on estimates or empirical judgment.
Timely identification of problems and opportunities
The data helps in the quick identification of trends, market changes, and potential risks.

Time saving
With the automation of reports, the time required for data collection and processing is significantly reduced.
Strategic planning
The dashboards and reports support the design and implementation of the company's growth strategy.
Are you facing these challenges?
We often encounter cases where:
- The data is located in many different Excel files
- The reports are prepared manually every month
- The management does not have an immediate view of the performance of the business, both departmental and overall.
- It takes a lot of time to collect, organize, format, and process data
- There are no necessary strategic organization skills and digital skills
- Opportunities are lost because information is not available in a timely manner
- Opportunities are lost because data is not utilized as it should be
The solution:
Business Dashboards
Business Dashboards transform your business data into visual and user-friendly reports that allow you to:
✔ You are monitoring the performance of the business
✔ you identify trends and growth opportunities
✔ You make faster and more informed decisions
✔ You save time from preparing reports
Dashboards are created with tools such as:
- Microsoft Power BI
- Microsoft Excel
and can be connected to your business data.

PARTNERS PS helps businesses organize their data and gain an immediate and reliable view of their performance..
Monitor your business results wherever you are.
Examples of business dashboards
Monitoring:
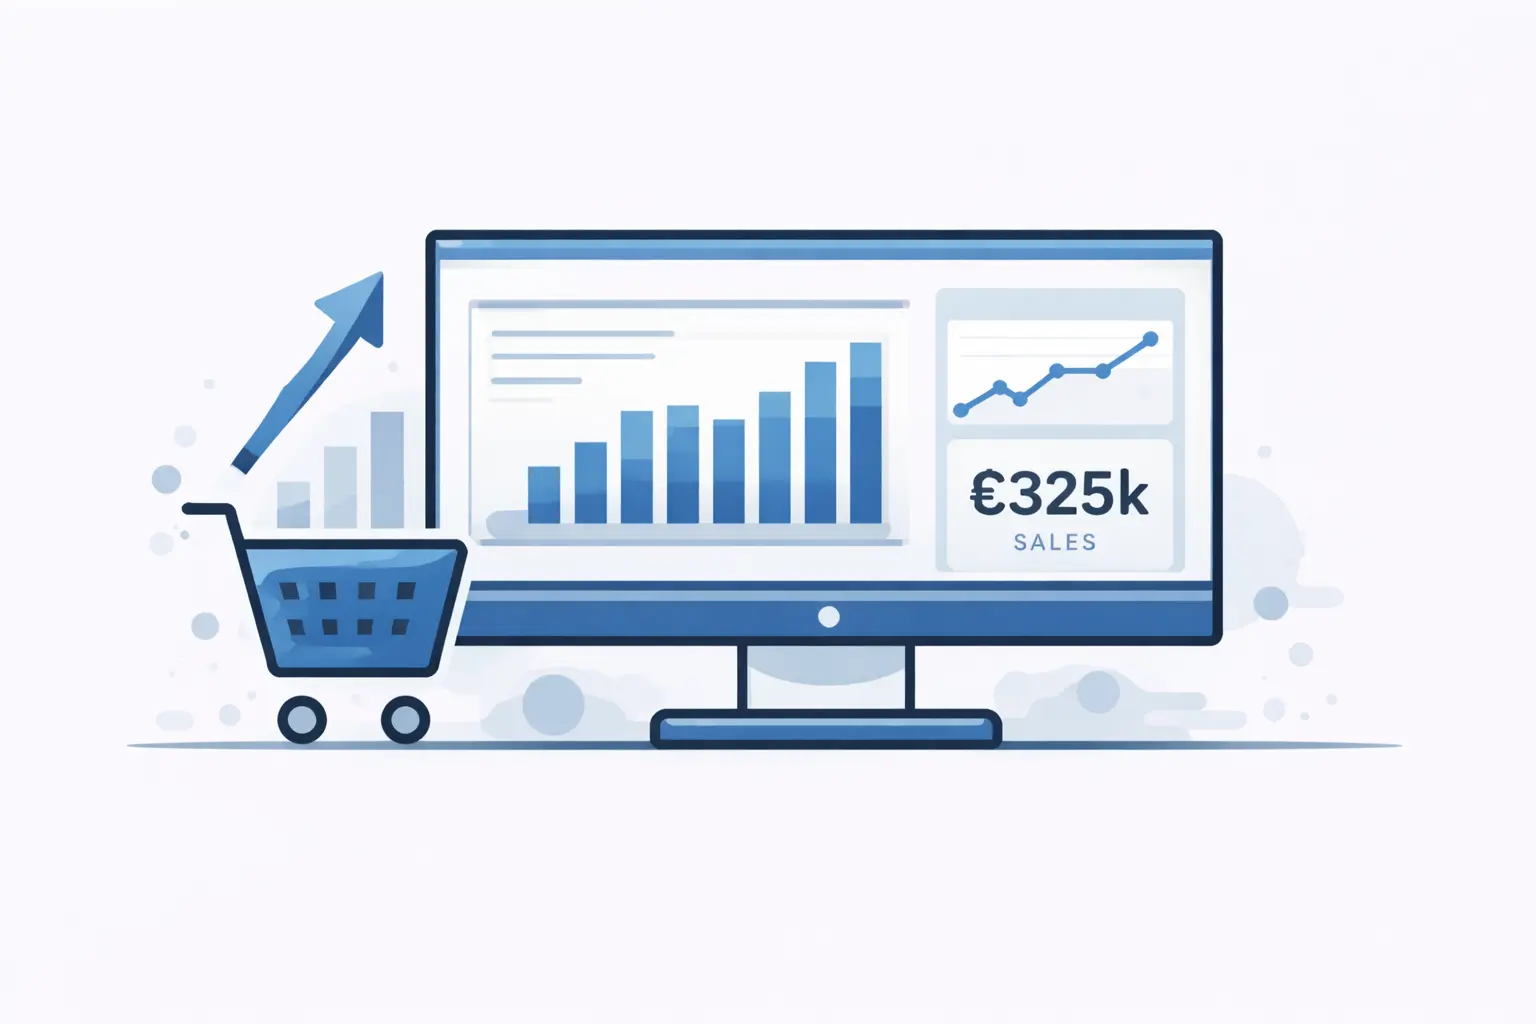
Sales
- total revenues and by period
- sales by product / category
- sales per salesperson
- sales by region
- sales trends
- top products or services
- top customers
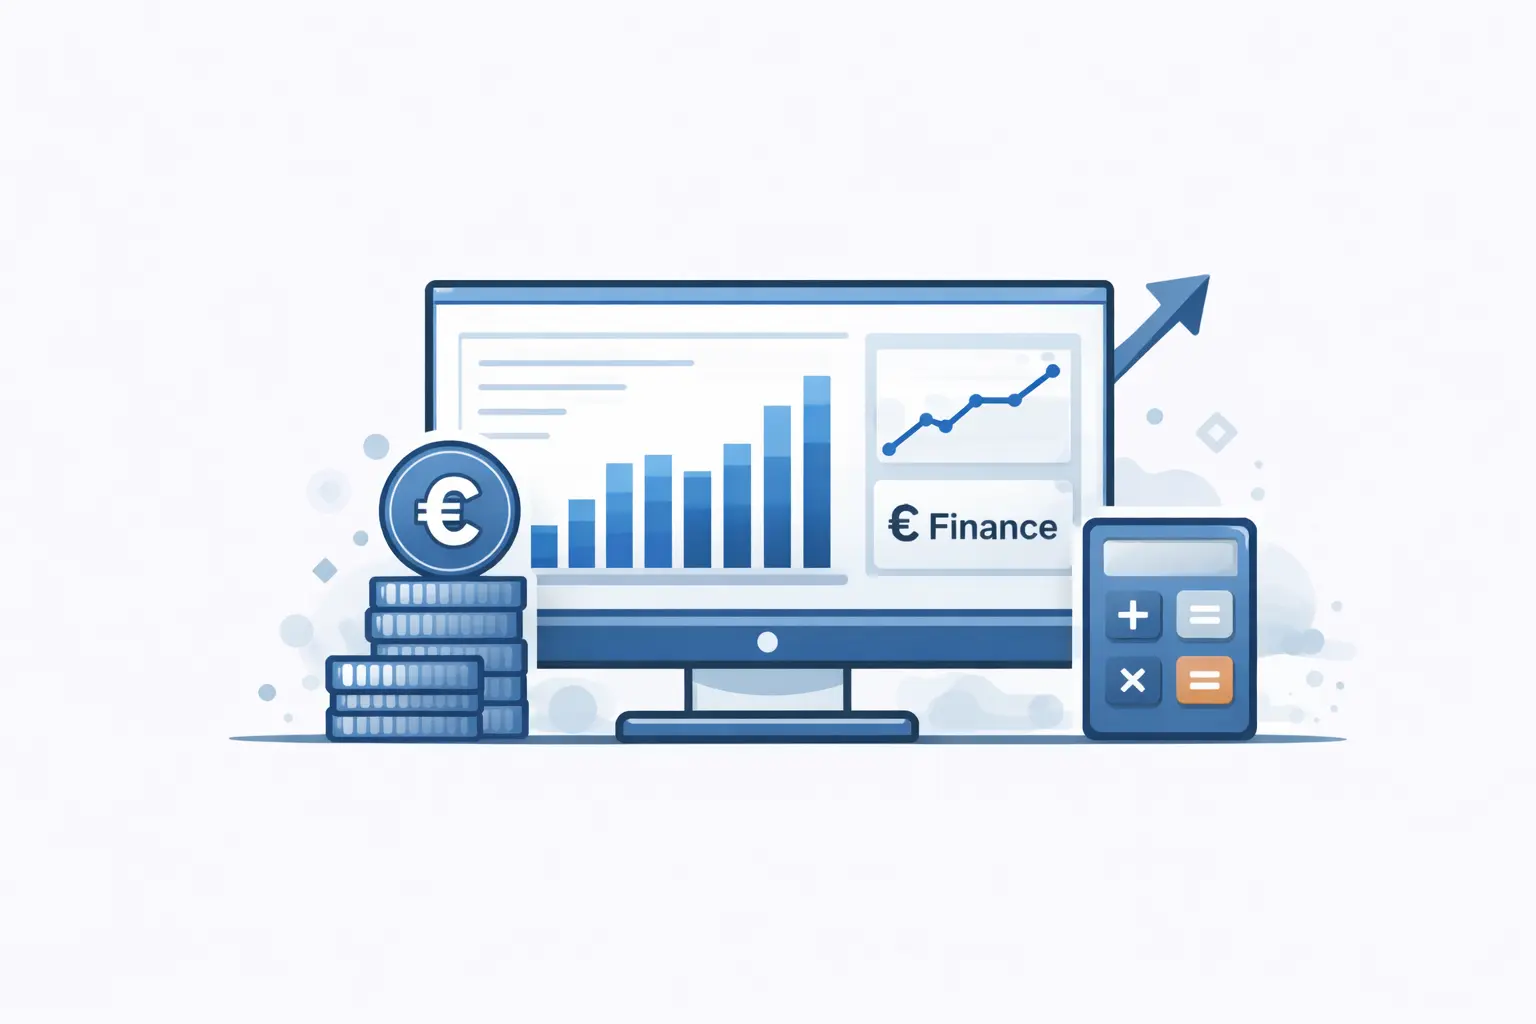
Economic Performance
- profitability - total
- profitability - products, projects
- profitability - customers
- profit margins
- operating expenses
- collection days
- cash flows
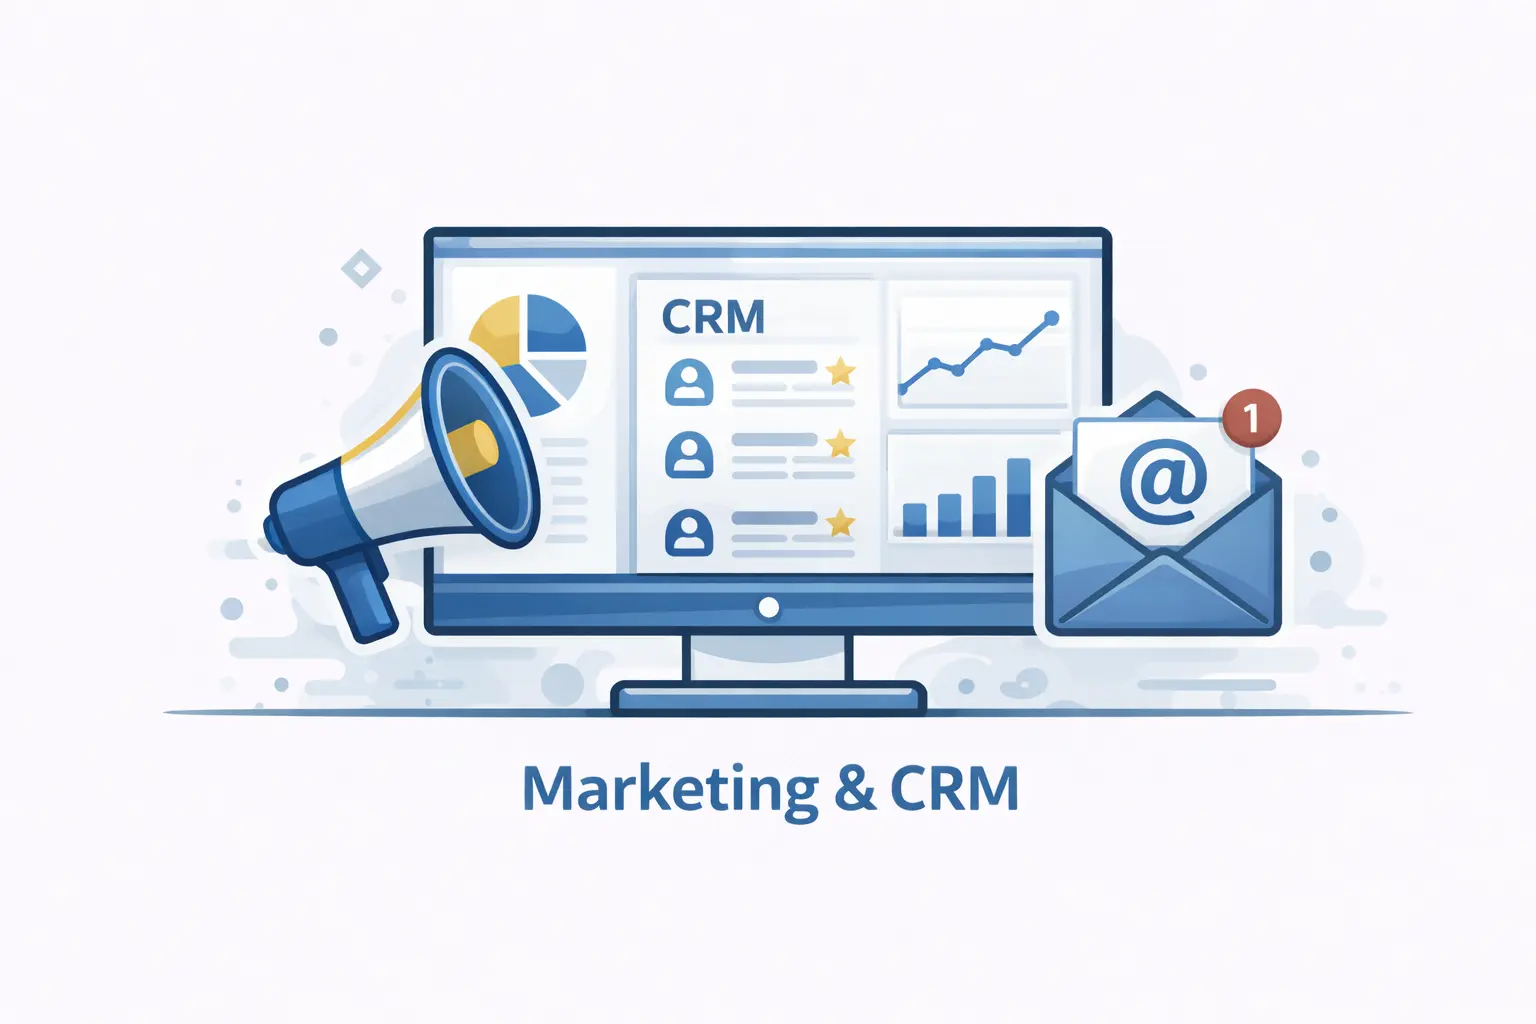
Marketing & CRM
- marketing channel performance
- acquisition of new customers
- campaign performance
- customer response
- customer loyalty

Human Resources
- Overview and demographics
- Recruitments, departures, and employee retention
- Employee performance and development
- Employee participation and satisfaction
- Compensation and benefits
- Absences and well-being
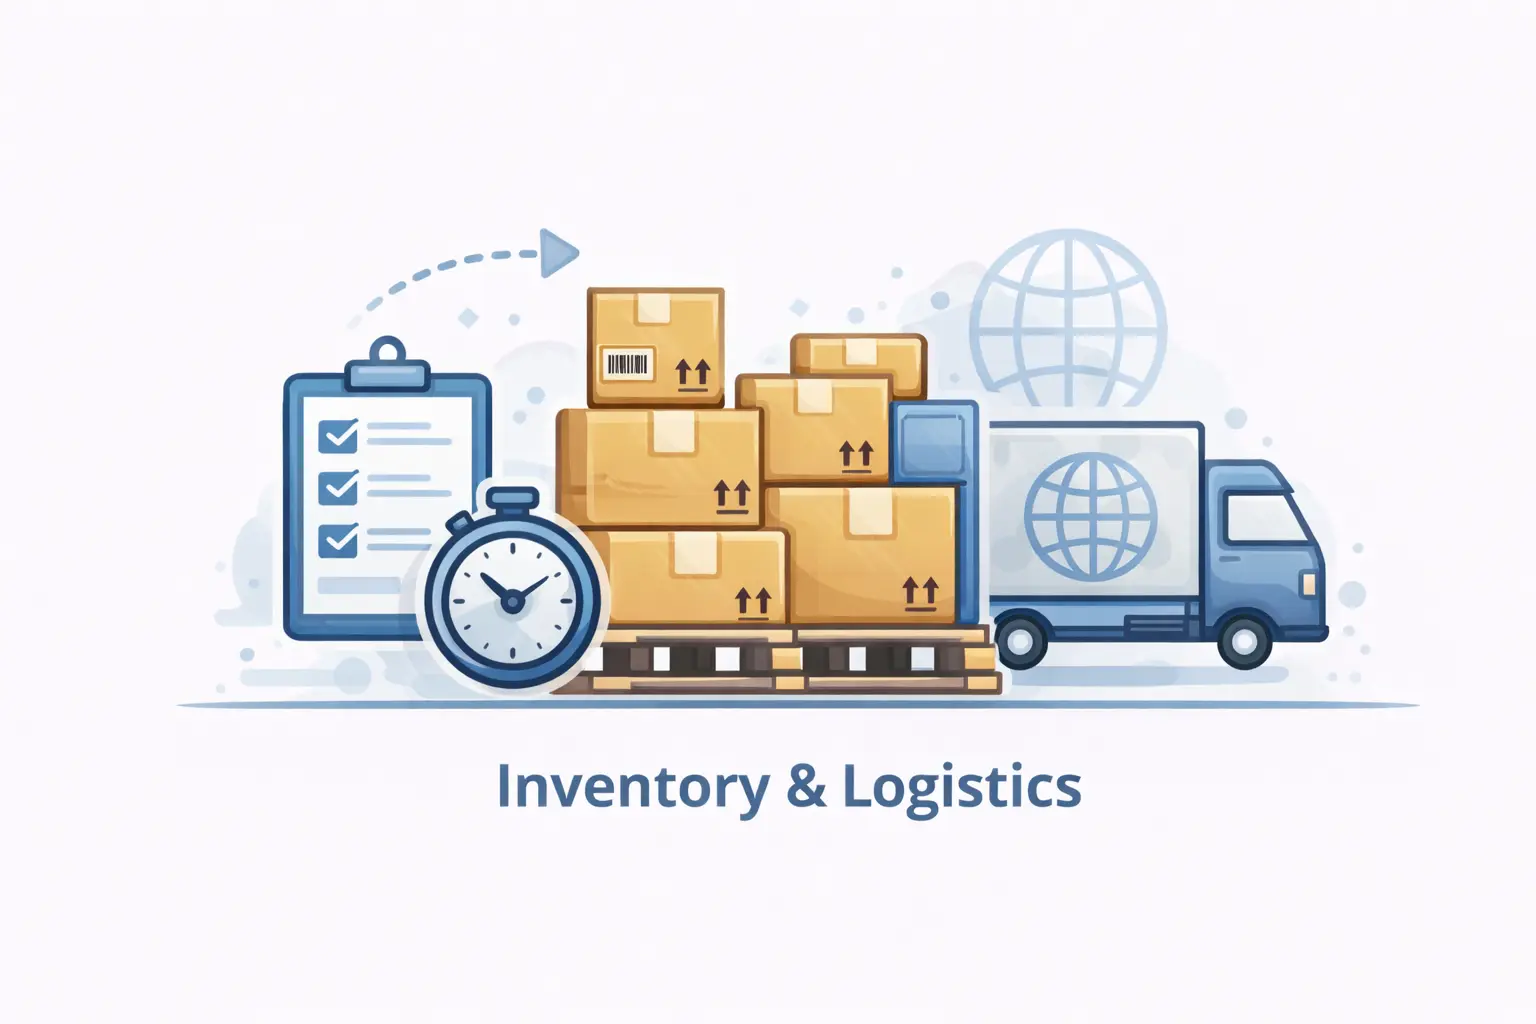
Inventory and Supply Chain
- Inventory levels and turnover rate
- Inventory Availability – Shortages, Surpluses, Losses
- Supplier times and performances
- Cost of goods sold
- Delivery times and logistics efficiency
Customized dashboards for every business
The dashboards are fully customized to meet the needs of each business and are designed for every department of the business.
The reports can be customized for different roles: Management, Sales, Marketing, Accounting, Human Resources, Supply Chain, Management Teams, etc.
Thus, each team has access to the information it needs to operate effectively.
They are designing a way to create an aesthetically pleasing and user-friendly presentation of the data:
- with the colors and the corporate identity
- with appropriate visual graphs and indicators
- based on the data available to the company
Data Visualization - Basic Charts:
- Column Chart
- Bar Chart
- Line Chart
- Pie Chart
- Scatter Plot
- Funnel Chart
- KPI Gauge
- KPI indicators
- Table
- Pivot Table / Matrix
- Dynamic filters
- Ect.
Report & dashboard automation:
- With the right data infrastructure, you can avoid the constant creation of the same reports.
- The dashboards can:
- they are updated automatically
- are connected to multiple data sources
- display updated information in real time
- Thus, the business saves time and can focus on strategic decisions.
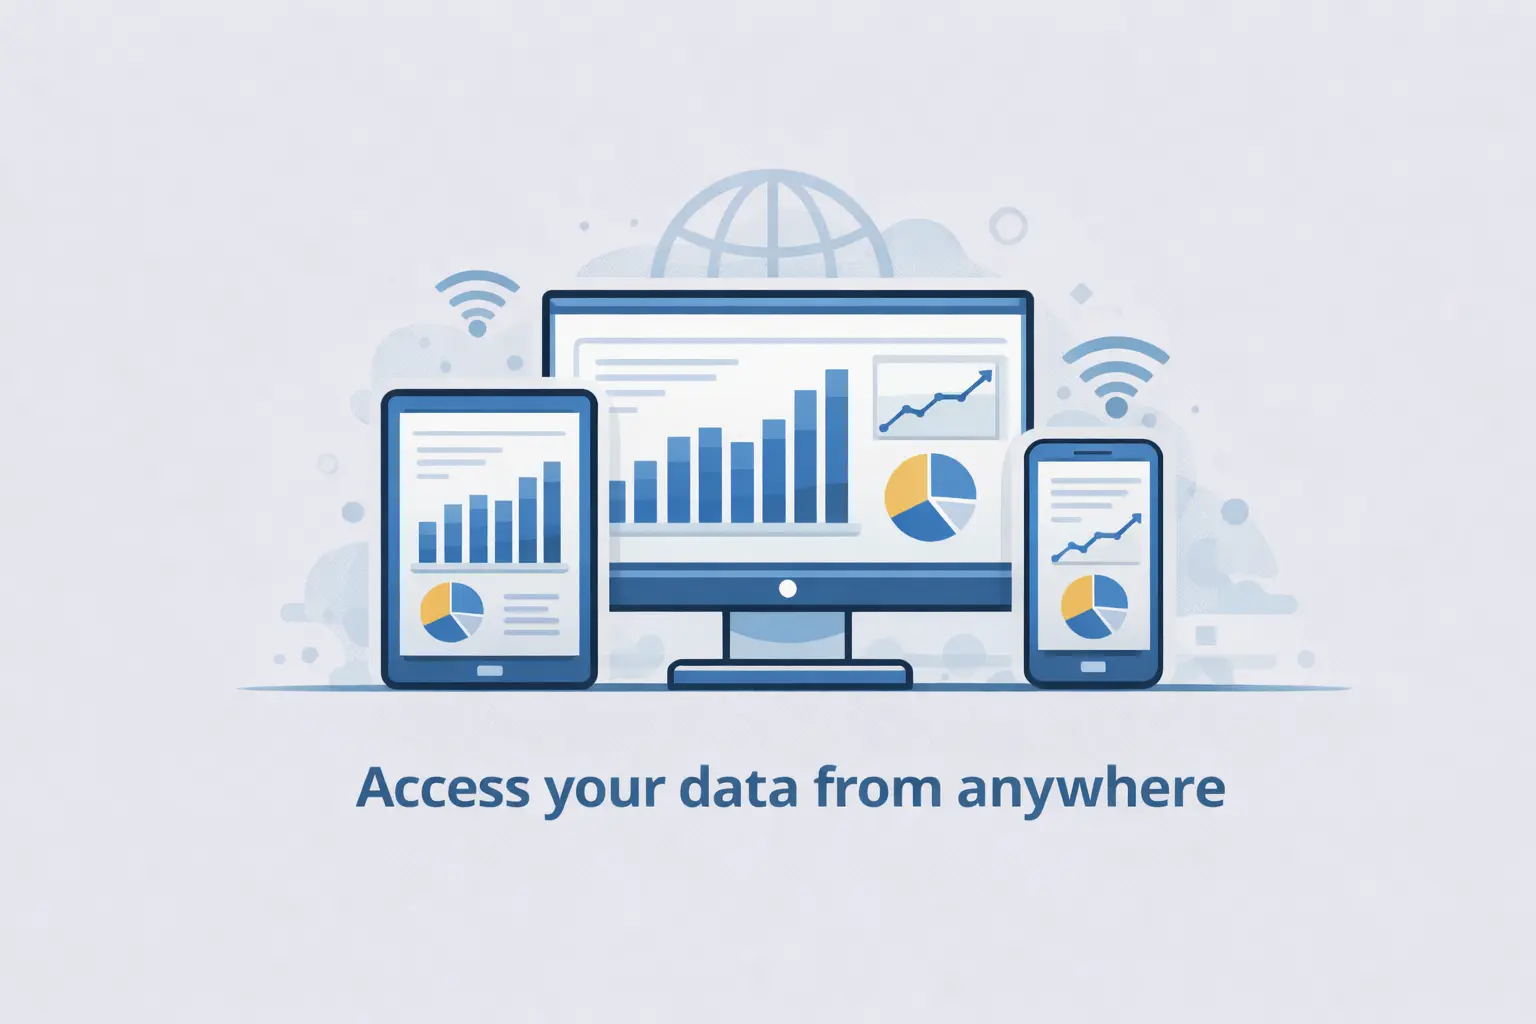
Access to data from anywhere
- The dashboards can be available through:
- computer
- tablet
- mobile phone
- Microsoft Power BI has apps for iOS and Android, allowing your team to access business data anywhere and anytime.
Consulting support from PARTNERS PS
At PARTNERS PS, we don't just offer informational seminars but also practical application workshops.
We collaborate with management and internal teams to redesign how your organization operates — using a structured methodology and delivering measurable results.
The PARTNERS PS team can support you at all stages:
✔ business needs analysis
✔ identification of key performance indicators (KPIs)
✔ design of dashboards and reports
✔ implementation of Power BI or Excel solutions
✔ training your team
Companies can also take advantage of HRDA (AnAD) schemes of subsidies.
Why PARTNERS PS
What We Do Differently
We do not merely implement tools.
We combine:
Strategic Thinking + Structured Processes + People + Technology
We design solutions that function effectively within the real environment of a Cypriot SME.
Specifically, we:
- Identify productivity gaps and their root causes
- Map and simplify processes before automation
- Prioritize opportunities with the highest business impact
- Design practical solutions tailored to your own data
- Implement structured and automated workflows
- Highlight automation risks before they become costly
Expertise & Certifications
- Specialization in Excel Data Automation
- Specialization in Power BI Analytics
- Certification in Artificial Intelligence for business users
- Extensive experience in Cloud Infrastructure & Web Platforms. Management of environments such as Microsoft 365 Workspace & Google Workspace, Odoo, Email Campaign Platforms, etc
- Many years of experience in redesigning strategy, organization, execution, and results analysis
- Application of a systematic risk assessment methodology and recommendations for improving internal control mechanisms and ways to ensure business continuity
- Preparation of over 40 completed studies-proposals for funding within the framework of the Ministry of Commerce
- Professional certifications from the International Institute of Internal Auditors in the USA
What This Means for You
- Lower risk of misguided technology investments
- Practical implementation — not theoretical presentations
- A structured methodology with measurable outcomes
- Collaboration with professionals who understand real business operations
- Correct diagnosis
- Assessment and prioritization of priorities
- Evaluation of suitable solutions for you
- Effective project implementation management
- Support and development of your people's capabilities
- Effective measurement, analysis of results, and continuous improvement
Next Step
Free initial data assessment
Discover how your business data can become a powerful tool for growth and decision-making.
Contact us for a 30-minute Business Data Utilization Discussion.
In the discussion, we will evaluate:
- what data your company has
- which reports are generated today
- which dashboards can help management
The goal is to identify opportunities to better leverage your business data with strategic benefits in mind.
You can’t manage what you can’t measure!
Expression of interest
Please contact us directly for more information.
Just fill in the details below and we will contact you shortly.
We are always eager for your best service!